
How correlated forex trades can increase your market exposure
Reading time: 11 minutes
You will very often find that some traders – particularly short-term market participants – isolate risk. What I mean is that they may trade EUR/USD (euro versus the US dollar), calculate their risk, and trade the currency pair. But what can be missed for those who trade multiple markets is that a currency pair seldom moves in isolation.
What is important to understand is that behind every currency is a shared driver. This could be due to a number of factors, including monetary policy (interest rate expectations), risk sentiment, or commodity prices. And if you are a trader who has more than one currency trade open at once, your risk exposure can be much larger than the sum of your individual risk suggests. This is the hidden danger of not understanding correlation in the forex market.
Forex correlation defined
Correlation is a term you will often hear when discussing the forex market, or any market for that matter. It is expressed as a coefficient between -1 and +1, and essentially tells you how much or how little two instruments move in the same direction.
Although rare, if two currency pairs have a correlation coefficient of +1 (-1), price action will move in exactly the same direction (exactly opposite) as one another. If the correlation coefficient is 0, this tells you that the two currency pairs exhibit little to no correlation. To be clear, correlations are in no way static; they frequently move and can be impacted by the economic environments of each country’s currency, their central bank policy, risk appetite, and even seasonal patterns.
Classic examples of correlated forex pairs
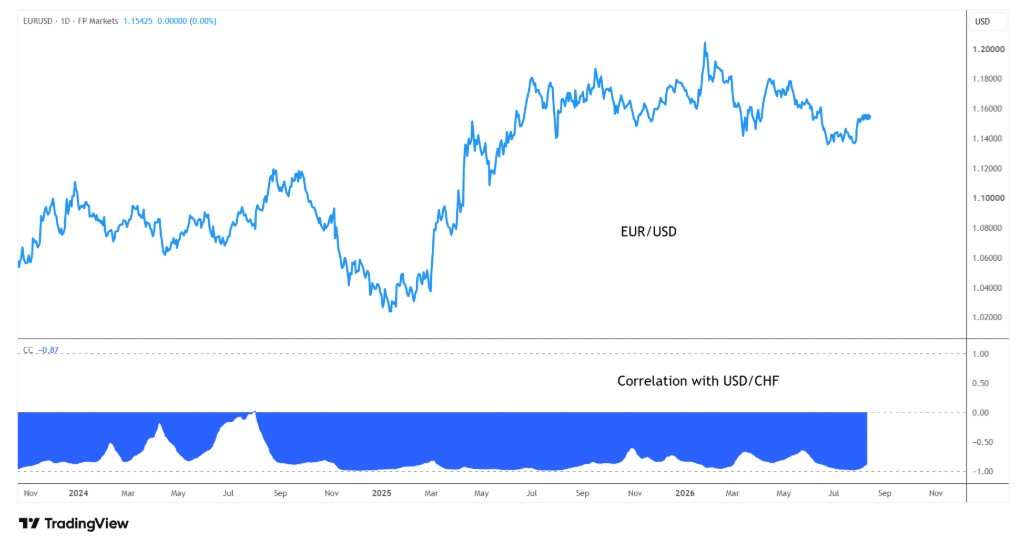
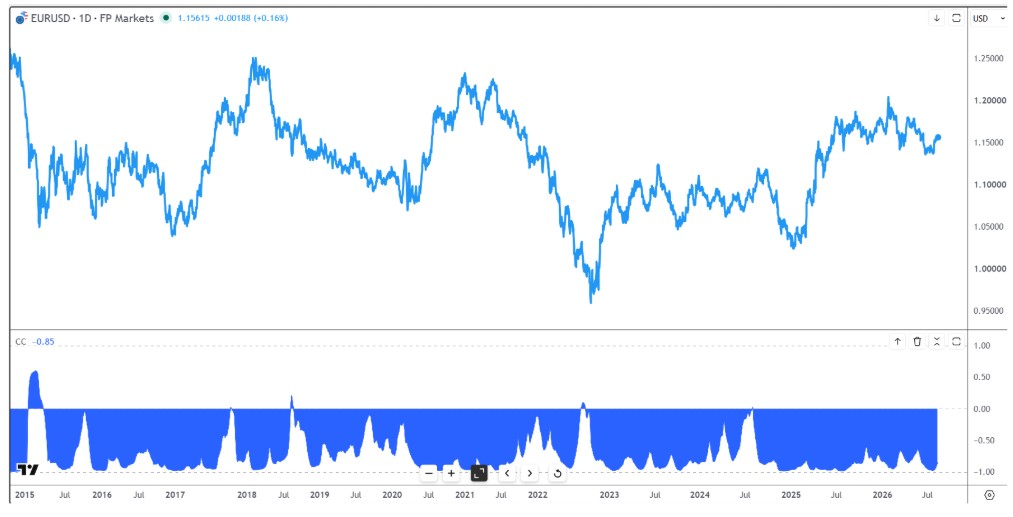
The EUR/USD and USD/CHF (US dollar versus the Swiss franc) possess a strong negative correlation, which, as noted above, means that when one pair moves higher, the other pair tends to move lower. I have purposely used line charts below to demonstrate this in Chart 1. However, you can also apply the correlation coefficient tool on TradingView, which I set to a rolling 60-day length in Chart 2. As you can see, it clearly shows how inversely correlated the two variables are, currently at -0.87.
These two pairs exhibit such a strong inverse relationship largely because the USD acts as the quote currency in EUR/USD and the base currency in USD/CHF. So, when the USD broadly appreciates, it tends to benefit USD/CHF, but weigh on EUR/USD.
Chart 1:
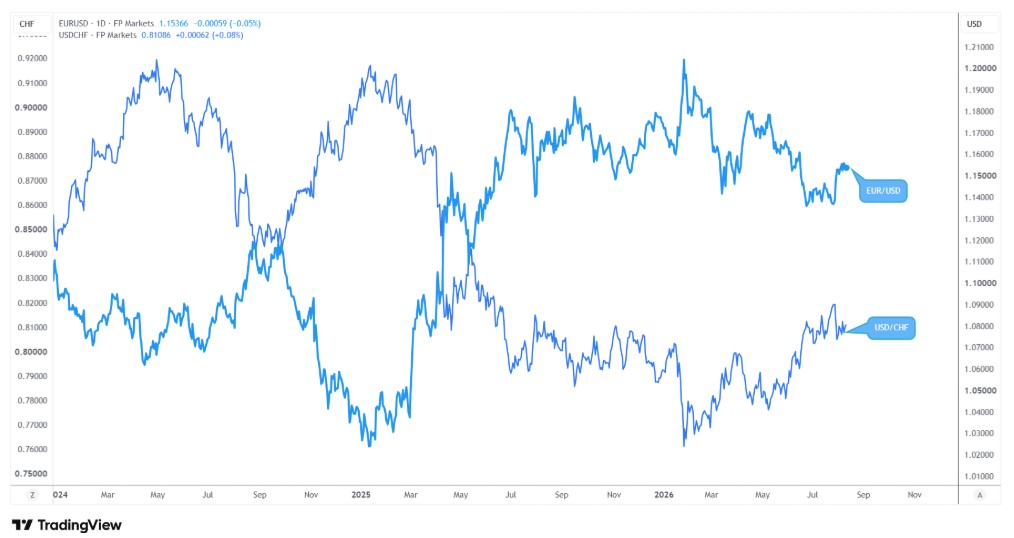
Chart 2:
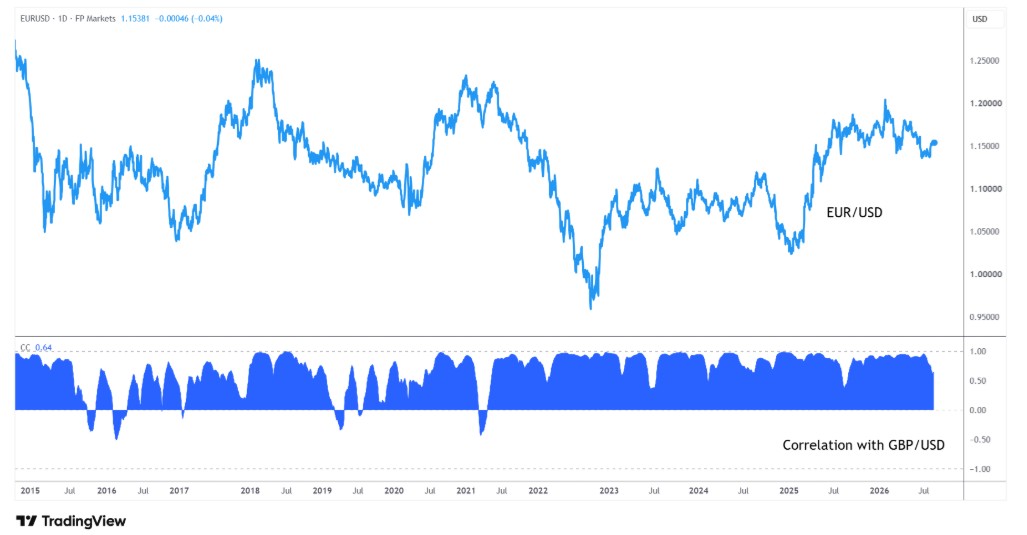
Another clear-cut example of correlation between currency pairs is between EUR/USD and GBP/USD (British pound versus the US dollar), which are among the most commonly cited positively correlated pairs.
Both have USD as the quote currency, and the EUR and GBP – the base currencies – often respond to similar macro forces, broad USD strength or weakness, and general risk sentiment in developed markets. When the USD rallies broadly, both pairs tend to fall together; when the USD weakens, both often rise.
As shown in the chart below, there are only a few times in history that EUR/USD and GBP/USD have been inversely correlated, but for most of the time, the correlation coefficient is +0.75 or above.
Gold-linked pairs such as AUD/USD (Australian dollars versus the US dollar) and XAU/USD (gold priced in dollars) have historically tracked each other reasonably closely, since Australia is a significant gold producer and the AUD has at times behaved like a proxy for commodity sentiment.
These relationships are not fixed laws of the market – they can weaken, strengthen, or even reverse – but they tend to persist strongly enough that ignoring them creates a blind spot in a trader's risk picture.
Currency pair correlation: Recognising exposure multiples
As with most things, when trying to explain a complex concept, it is often best to do so with an example or two.
Imagine you are long the EUR/USD currency pair (for those unaware of the terminology, ‘long’ refers to a buy, while ‘short’ is a sell), and you decide to also go long the GBP/USD. You have risked 1% of your account equity on each trade. While at first glance, this may appear disciplined trading, risking 1% per trade, the reality is that you have essentially walked into a trap that a lot of beginner traders unfortunately find themselves in, referred to as correlation risk.
While you may think that you have simply risked an isolated 1% per trade, the issue is that the USD is the quote currency in both pairs. This means that while you are long the EUR and GBP, you are simultaneously shorting the USD twice. Because the EUR/USD and GBP/USD move in tandem about 70-80% of the time – both responding directly to USD strength or weakness – you have not split your risk.
The reality is that you have placed a single, 2% trade on USD weakness. If the USD suddenly appreciates – let’s say that the Fed suggests rate hikes are near amid strong inflation data – you will not lose just 1% on one trade while the other pair holds its ground. You will often lose 2% all at once given their strong correlation, instantly doubling your planned risk.
Of course, trading multiple currency pairs simultaneously compounds your correlation risk. Imagine you go long on EUR/USD and GBP/USD, while also shorting USD/CHF at a key resistance level. Because USD/CHF is inversely correlated with EUR/USD, adding this short position does not diversify your portfolio. Instead, it creates one large, concentrated trade betting entirely on USD weakness, compounding your total risk to 3%. Consequently, if the USD strengthens, all three positions will reverse simultaneously, triggering a maximum 3% loss across your account.
Another point to highlight is that correlations can increase during times of volatile events. For example, a major event, such as the Fed surprising the markets by cutting its target rate or US inflation data deviating broadly to the downside, can trigger a risk-on move. This can see not only the USD fall, but also US Treasury yields, with stock indexes (think the S&P 500 and the Nasdaq Composite) and gold rallying. My point is that even if you account for current correlations under usual market conditions, a high-impact event can transition into a single concentrated trade in highly volatile market conditions.
Measuring and monitoring currency correlations
I predominantly use two methods to actively keep track of correlations.
The simplest way is through using a correlation matrix. Consider the FP Markets correlation tool (or ‘correlation table’), which is simple to use and offers a snapshot of correlations over different time periods. These correlation matrices show coefficients between major currency pairs over selected time windows. Because correlations shift over time, checking a matrix periodically, rather than assuming last year's relationships still hold, is important.
The other way is through rolling correlation charts, similar to the ones I used above. With access to TradingView, you can set these up simply by following these four steps:
1. Open the EUR/USD daily chart, select the indicator tab on the upper panel and then choose the ‘Correlation Coefficient’ indicator.
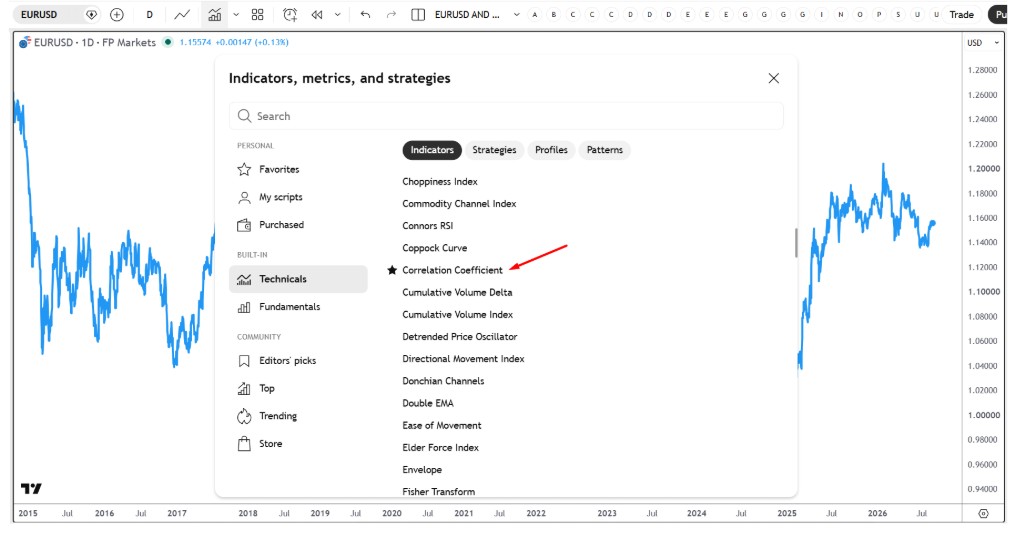
2. Select your symbol of interest. In this case, I have chosen USD/CHF.
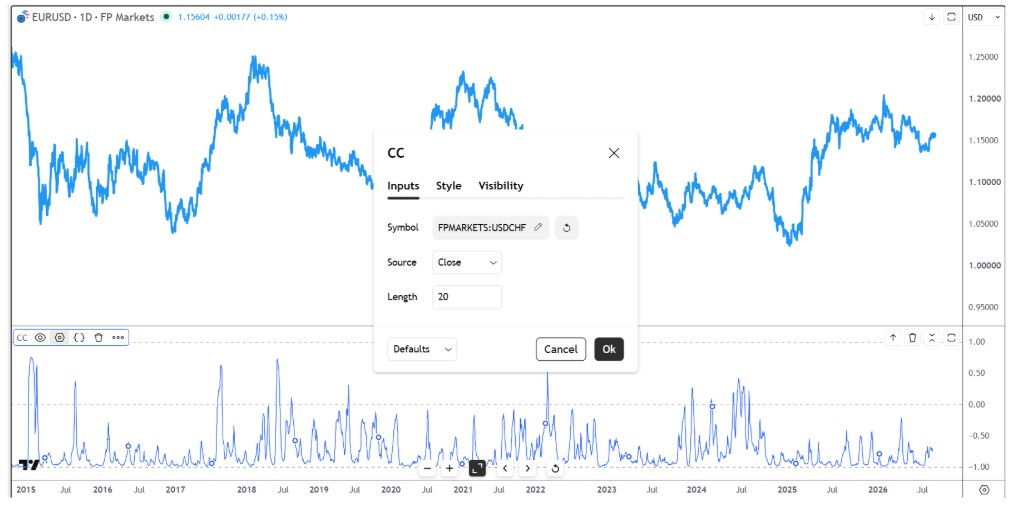
3. I always change the settings to expand the length to 60 days to cover three months, and then change the ‘style’ to reflect an ‘area’. The changes will leave you with a chart like the one below:
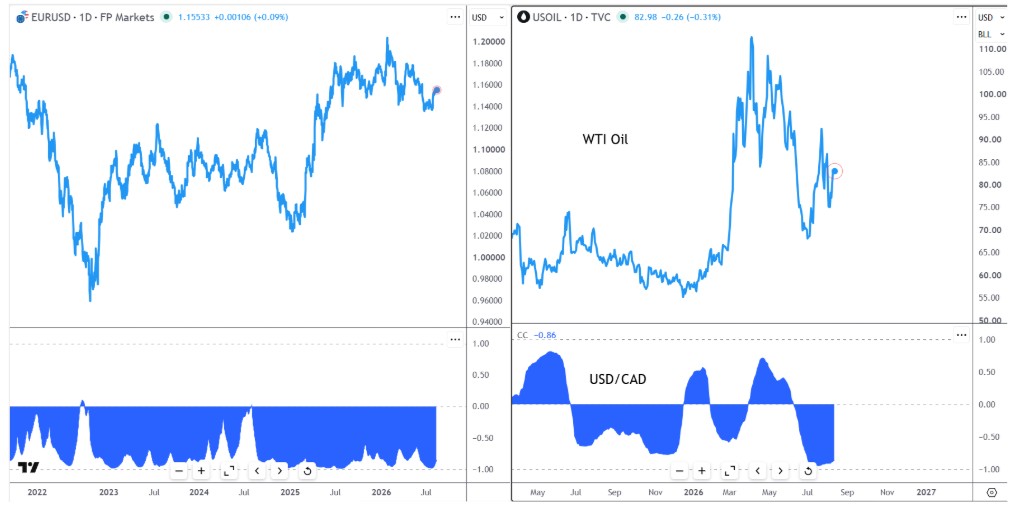
4. Finally, I always change the layout setup so I can view many correlation charts at once. The example below shows the EUR/USD and USD/CHF setup to the left, while the right panel shows the daily chart of WTI oil (West Texas Intermediate) and the USD/CAD (US dollar versus the Canadian dollar) – which currently shows the two markets are inversely correlated: a correlation coefficient of -0.86.
Conclusion: Correlations can be used to your advantage
While correlation risk is a very real thing and one I strongly believe all traders need to be conscious about, it can be used deliberately to share a directional view to express higher conviction on a theme. Problems arise when it is not deliberate, and suddenly you have 5% of your trading account equity exposed.
For instance, if you have a long position open on EUR/USD and are trading a trend, and you expect some downside but ultimately feel it will continue in the long term, rather than setting a stop close to price (however, I would always advocate a hard stop), you could simply take a long position in USD/CHF – knowing that most of the EUR/USD downside will be offset by your long position in USD/CHF, given the inverse correlation. This is essentially hedging your EUR/USD position using a correlated pair, rather than diversifying – you are deliberately leaning on the correlation to offset risk, not spread it across unrelated markets.
Written by FP Markets Chief Market Analyst, Aaron Hill