
How to draw trendlines and identify market trends
Reading time: 8 minutes
A chart can contain hundreds of price movements, but traders do not need to study every candle to understand what the market is doing. Sometimes, a simple line connecting a series of important highs or lows can reveal the bigger picture. That line is called a trendline. It can help traders see whether buyers or sellers are gaining control, whether a trend is strengthening and when the market may be starting to change direction. Used correctly, trendlines can turn a busy price chart into something much easier to read.
Think of a trendline as a road drawn through that pattern. It doesn’t predict exactly where the market will go but can help traders see whether price is generally moving higher, lower or sideways. This matters because identifying the direction of a market can shape how traders approach potential opportunities.
Learning how to draw trendlines can help traders identify market trends and interpret price movements. The process is straightforward, but drawing a trendline requires more than simply connecting two points on a chart.
What is a trendline?
A trendline is a straight line drawn on a price chart to connect important swing points. Traders generally use it to visualise the general direction of price movement. An upward trendline connects a series of rising lows, while a downward trendline connects a series of falling highs. If price lacks a clear upward or downward direction, it may move sideways within a range instead.
A trendline does not need to touch every candle. The goal is to capture the broader structure of the market rather than force every price movement into one line. Before drawing the line, it can help to understand the three basic market conditions:
Uptrend: Price forms higher highs and higher lows.
Downtrend: Price forms lower highs and lower lows.
Sideways market: Price moves within a relatively defined range, often between support and resistance, without a clear upward or downward direction.
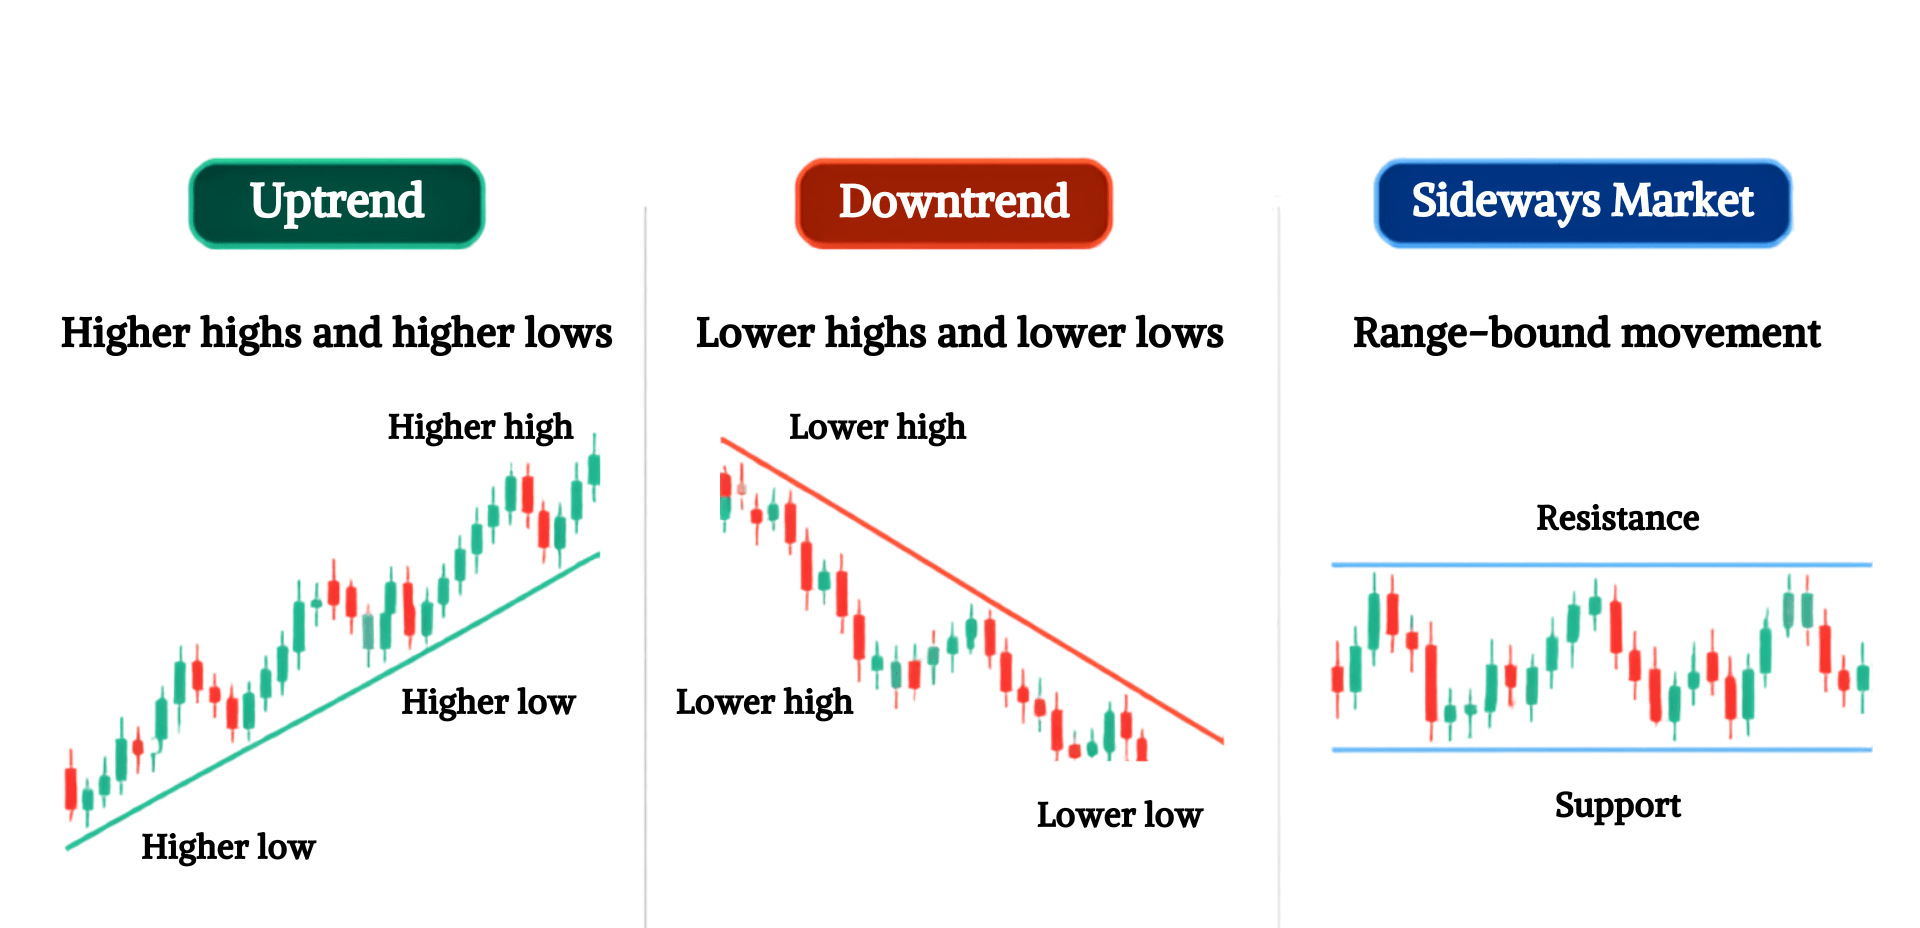
Basic market trends
How to draw trendlines
The process is relatively simple, but choosing the right points and timeframe is important.
Step 1: Start with the right timeframe
Traders typically start by considering their trading approach and choosing a timeframe that matches their analysis. A day trader may focus on shorter timeframes, while a swing trader may look at four-hour or daily charts. A longer-term investor may study weekly charts. The same asset can show an uptrend on a daily chart and a short-term downtrend on an hourly chart. Neither view is necessarily wrong. They simply describe different parts of the market.
Step 2: Identify the swing points
Usually, traders look for clear highs and lows where price changed direction. For an uptrend, they identify at least two meaningful lows and connect them with a straight line. They could then extend the line forward to see whether future price action continues to respect it. For a downtrend, they would commonly identify two meaningful highs and connect them. Two points can allow you to draw a line, while a third reaction can give the line more significance because the market has interacted with it again.
Step 3: Avoid forcing the line
A common beginner mistake is adjusting a trendline until it fits almost every candle. Instead, experienced traders typically start with the clearest swing points and accept that some candles will sit above or below the line because price isn’t perfectly linear. A useful trendline can make the market easier to understand. If it makes the chart more confusing, it might be better to start again.
Step 4: Look for repeated reactions
The more meaningful reactions a trendline receives, the more useful it may become as a reference point. Suppose EUR/USD rises, pulls back to an upward trendline and then moves higher. If this happens several times, traders may pay closer attention when price approaches the line again. However, repeated tests do not guarantee that the line will continue to hold as trends can weaken or reverse.
How to identify market trends
Learning how to draw trendlines is only useful if you understand the market structure behind it. Experienced traders generally look for higher highs and higher lows in an uptrend. Here, buyers are typically willing to push price to new highs, while pullbacks remain above previous swing lows. In a downtrend, price tends to make lower highs and lower lows as sellers keep pressure on the market and rebounds fail below previous highs.
If price keeps moving between similar highs and lows, the market may be ranging. In this situation, a horizontal support or resistance zone can be more appropriate than a diagonal trendline.
Using price action to confirm the trend
A trendline is usually not treated as a standalone signal. Traders generally watch how price behaves around the line. A bounce can suggest that the trend remains intact, while a decisive break may indicate that momentum is changing. However, one move through the line does not automatically confirm a reversal.
This is where swing structure becomes important. In an uptrend, a break below the trendline becomes more significant if price also starts forming lower highs and lower lows. Similarly, in a downtrend, a break above the line matters more if the market begins producing higher highs and higher lows.
Volume can also add context in markets where reliable volume data is available. A strong price move accompanied by increased activity may deserve more attention than a weak move on limited activity. A strong price move accompanied by higher volume may provide more evidence of participation than a similar move on relatively low volume. However, volume should be interpreted alongside price action rather than used as confirmation on its own.
Trendlines as support and resistance
Trendlines often work alongside horizontal support and resistance. An upward trendline can act as dynamic support and a downward trendline can act as dynamic resistance. When a horizontal level and a trendline intersect near the same price area, traders tend to pay closer attention to that area. This does not mean the market must reverse there. It simply creates a level that might be worth monitoring.
For example, imagine an asset trading in an established uptrend. If its rising trendline meets a previous support level, traders have two technical references pointing to the same area. They may then watch price action more closely for signs of a bounce or a breakdown.
What do trendline breaks mean?
A trendline break can be an early warning that market conditions are changing. Imagine an asset that has been rising for several weeks. Price repeatedly respects an upward trendline but then falls below the line. That break may indicate that the previous structure might have been disrupted. However, it does not, by itself, prove that a full downtrend has begun.
Experienced traders usually wait for additional evidence. Price may retest the broken trendline and fail to move back above it. It may also form a lower high and then break a previous swing low. Together, these signals can provide additional evidence that the market is shifting. The same principle applies to a downtrend. A break above a downward trendline tends to become more meaningful when price begins creating higher highs and higher lows.
Building a practical trendline strategy
Traders generally start by choosing their timeframe. Here, they identify the major swing highs and lows. Then they determine whether the market is forming higher highs and higher lows, lower highs and lower lows, or moving sideways. The trendline can then be drawn using the clearest swing points. Traders usually watch how price behaves when it approaches the line. They commonly look for confirmation rather than assuming the line will hold.
If the trendline breaks, they typically step back and reassess the market structure. Has price actually changed direction, or has it simply experienced a short-term move? However, it is important to remember that trendlines can help understand price structure. They cannot guarantee what happens next.
Use trend analysis for trading decisions
Learning how to draw trendlines can be a useful technical analysis skill, but their value comes from using them correctly. A well-drawn line can make the direction of a market easier to see and help traders recognise when that direction may be changing. The key is not to draw more lines but to identify the few that reflect meaningful price structure.
For traders who want to combine chart analysis with flexible market access, FP Markets offers more than 10,000 instruments across forex, shares, indices, commodities, bonds, ETFs and digital currencies. Use tight spreads and low-latency execution for trendline trading by opening an account with FP Markets.
Frequently asked questions (FAQs)
A trendline is a line drawn on a price chart to connect important swing highs or lows. It helps traders identify the direction and structure of a market.
Two meaningful swing points are enough to draw a trendline. A third reaction can provide additional confirmation that the line is relevant.
A trendline break can signal weakening momentum or a possible change in market direction. Traders should look for confirmation from price structure and other evidence before treating it as a reversal.